Manchester City's 2022/23 Finances with a 10 year outlook!
A historical season on and off the pitch
Manchester City on the field historical treble season has as suspected ended in off the field historical success.
Chairman, Khaldoon Al Mubarak, said:
“In short, last season saw Manchester City achieve the greatest football and commercial year of its storied history. The season was the validation of a philosophy and sustained approach that has defined the Club since His Highness Sheikh Mansour became its custodian in 2008.”
Manchester City has hit £713m in operational revenue
From last year Commercial income has increased £32m to £341m, Matchday £17m up to £72m and Broadcast by £50m to just shy of £300m
This is mainly due to a really successful season on the pitch.
10 years of Revenue Outlook
Over a 10 year Period City has shown year on year revenue growth except 2020 (covid year). Doubling their revenue from 2014 to 2023.
From last year to this year saw City grows its overall revenue by 16%
10 years of Matchday Revenue
Most surprisingly was the matchday increase from £55m to £72m as matchday revenue has always been around that ~£50m mark. This year saw it go up by 32%.
10 years of Broadcast Revenue
Making a CL final alone will help increase broadcast revenue but additionally the premier leagues overseas broadcast deals have also increased which saw City add £50m in revenue in that category alone (a 10% increase on last year)
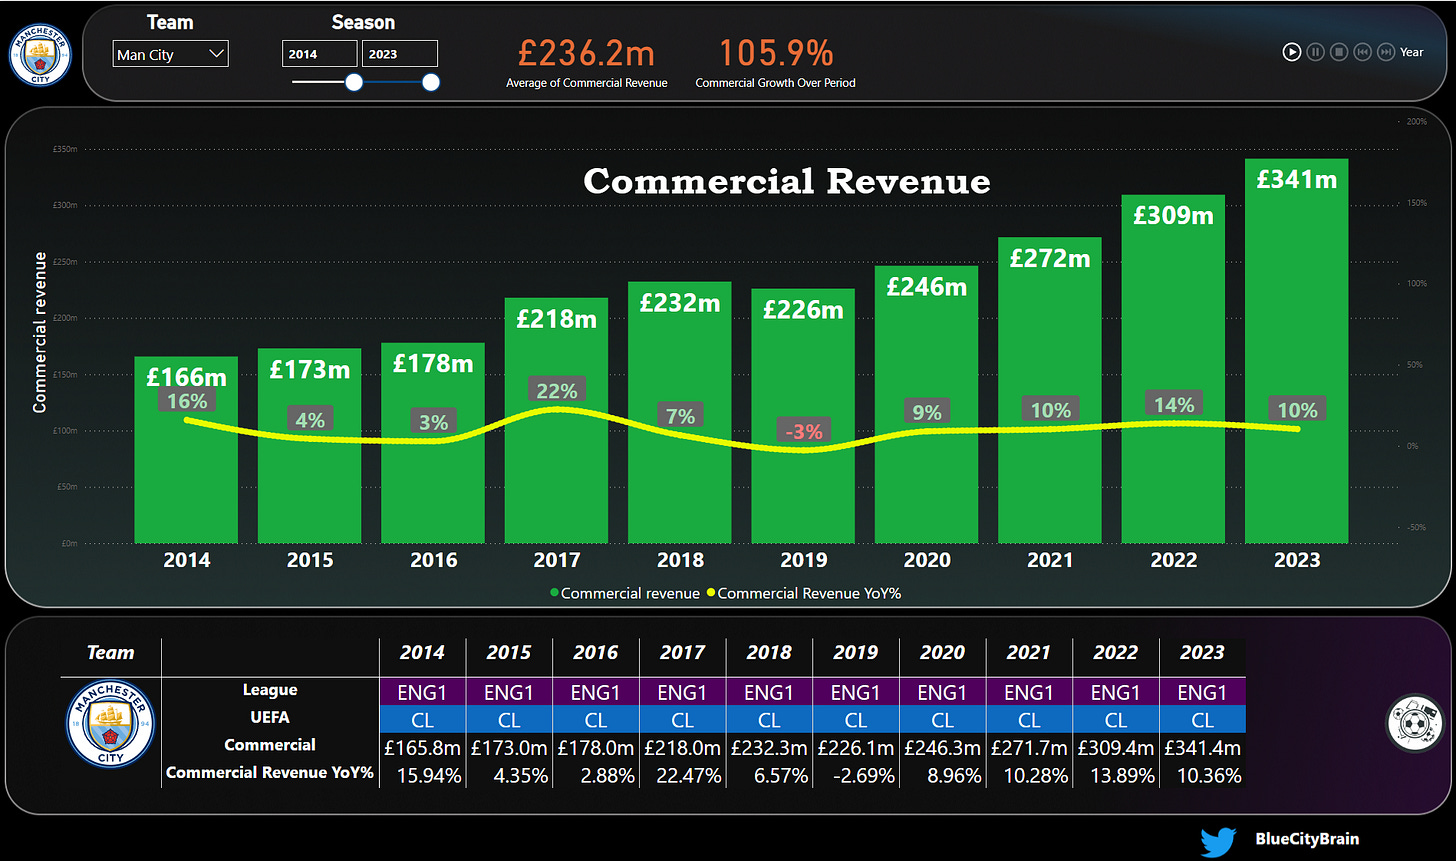
10 years of Commercial Revenue
Commercial income will also naturally increase the more successful a club is over time and there is always the potential for clauses to trigger from sponsorships based on what you win or how far you progress. We have seen this in Manchester Uniteds accounts where 2 successful seasons not making the champions league means a reduction in 25% of their Addidas contract
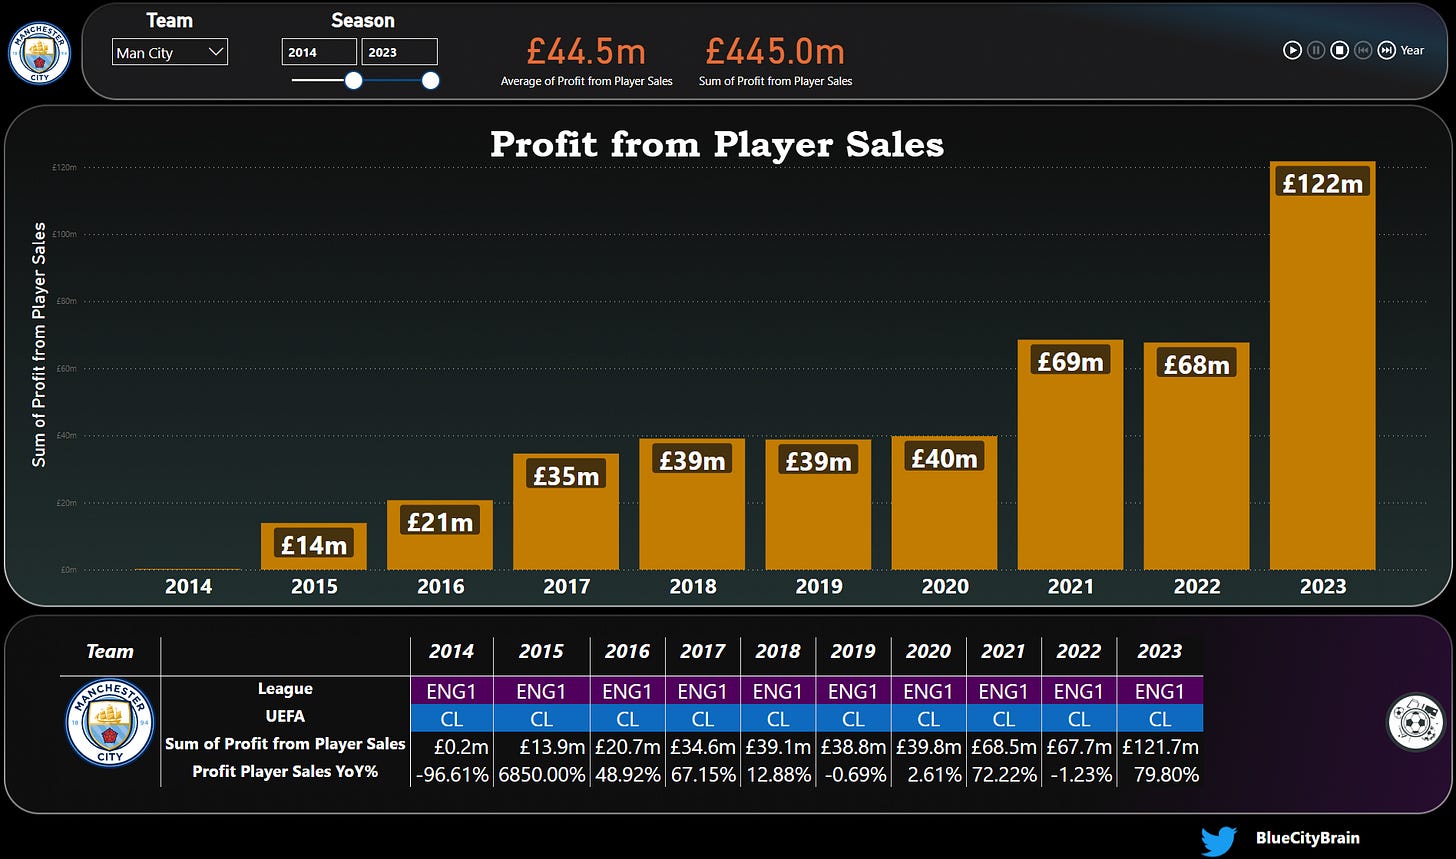
10 years of Player Profit on Sales
Citys record £122m in profit player sales in 2023 shows the transition the club has gone through in how it operates.
City have become really good sellers of both their academy talent and knowing when to sell players that want to leave. In the last 3 years alone (£258m) theyve made more in player sale profit than the rest of the Mansour era (2008 to 2020) combined (£226m). Additionally players such as Cole Palmer, Aymeric Laporte and Riyad Mahrez all will not have counted as part of this Profit from Sales as they will be on the 2024 accounts. So expect another similar profit in this area.
10 years of Profit/loss
This has led to a great year on the profit side as the club returns to strong profit before tax where City made £80m profit a historical high and almost double last years £40m. Over the last 10 years this accumulates to a £30m profit with the 2020 Covid season heavily impacting the club overall with 8 of the last 10 years being profitable.
10 years of Wages
However, this success does come with higher costs. Winning a treble means players, agents, staff and managers are all rewarded sweetly due to the innate bonus structure that most football clubs operate under
City’s wages have ballooned out to £423m a 20% increase on last season.
10 years of Amortisation
Amortisation has stayed fairly steady over the last 4 seasons showing a restrained hand in the transfer market when it comes to purchases and managing contracts.
Based on media fees and calculating new contracts I’ve got the first team right now costing City around £116m in Amortisation – however its important to note that add-ons and agent fees are not always added into a transfer fee and thus why the £146m from the accounts is always more accurate.
10 years of Net Spend and Transfer Activity
The same applies to the transfers on the accounts as City reported a net spend of £40m (£220m in purchases and £180m in sales). This is partly due to transfer windows not matching up with a full accounting period. For example Kovacic purchase was prior to the financial year ending. You can see here how manually collected fees per year differ to accounting period transfer fees.
You can check my media net spend thread with the link below:
Premier League Net Spend Summer 2023 Analysis
Another window has come to a close and with that one of my mega threads detailing all transfer activity across the last 5 seasons including the 2023/24 Summer window! So Lets begin first with the 2023/24 Summer Window Chelsea has the highest net spend at £171m - with United, Arsenal, Liverpool, Tottenham, Newcastle and SHOCK Bournemouth all cracking over …
10 years of “Squad Cost”
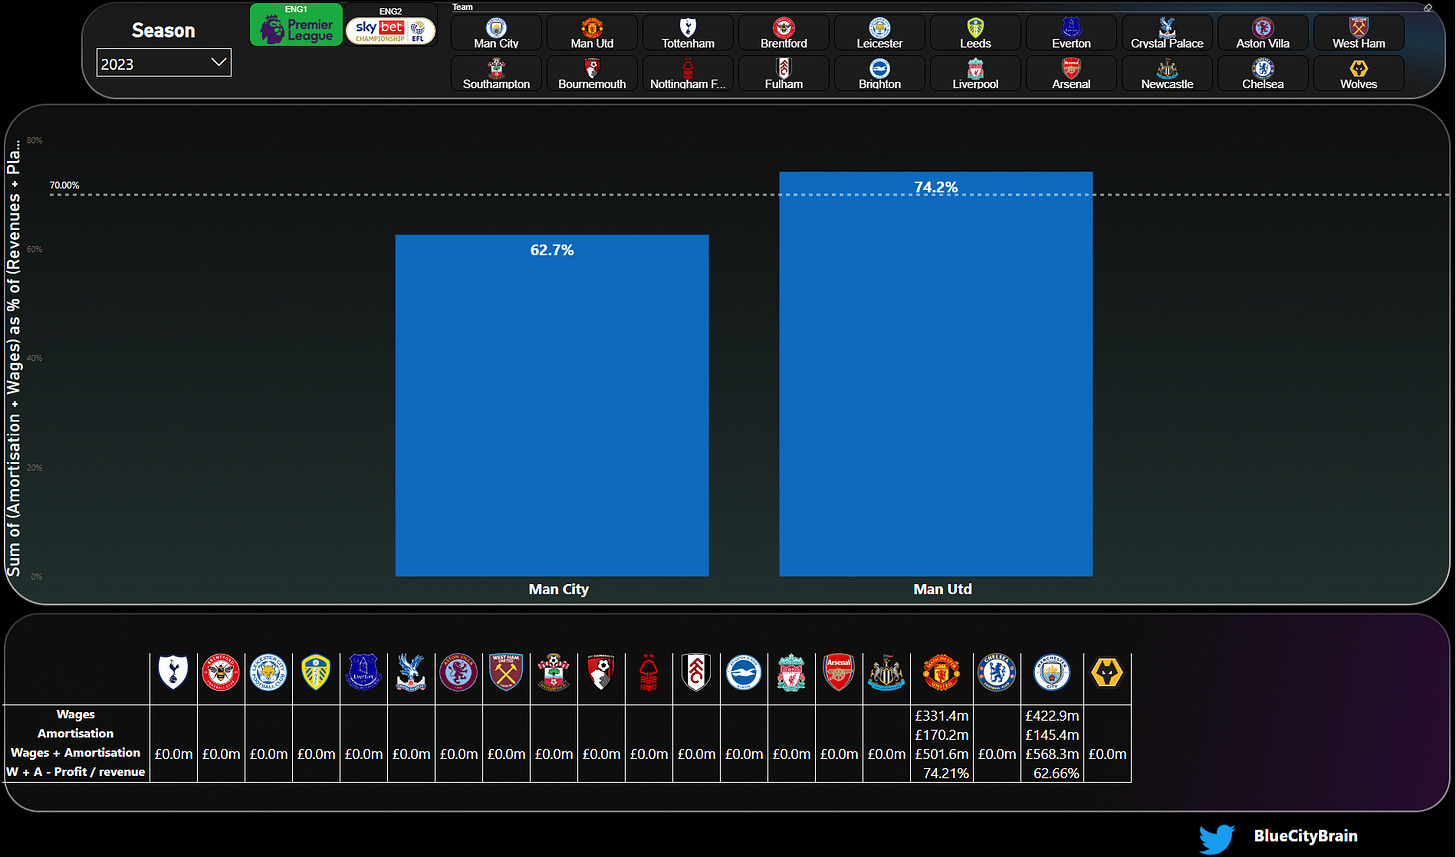
A good measure is to look at a combination of amortisation + wages to know how much a squad costs to put together for that season. In football we tend to look at transfer fees or net spend as a means to understand a football clubs sustainability or squad cost. But the best measure is a combination of these 2 metrics
Citys treble season cost them a whopping £568m but most importantly on the sustainability side was still a healthy way below 70% which will be required by UEFAs new financial sustainability rules by 2025/26. For 2023/24 it will be at 90% and the year after 80%
10 years of Ownership Funding and Cash
On the ownership side Citys ownership have made little to no investment into the club over the last 10 years
While cash is maintained at a similar level to last year.
However to be fully transparent Citys ownership did invest heavily prior to this 10 year period - with £1.1bn invested into the club to get it to where it needs to by today
and while I have not done many comparisons due to not many clubs having their 2023 accounts released here is a full picture of premier league clubs ownership funding in the last 10 years with all the below besides City and United not knowing their 2023 accounts.
Looking ahead I will be doing more comparison graphics in future but as of right now not many clubs have released their 2023 accounts as mentioned above
but I do look forward to sharing things such as below:
10 years a Summary:
If you are looking for a single stop graphic of a bunch of key metrics look below:


